
GOOG Valuation for 08-11-2026
Google crushed earnings, but capex is still high and free cash flow may suffer

Google reported Q2 ‘26 earnings after the bell a few weeks ago and the stock fell on the results. The stock fell +6% post earnings after the news on amazing Google Cloud growth but a raise in AI capital expenditures. Here are some more highlights from the quarter.
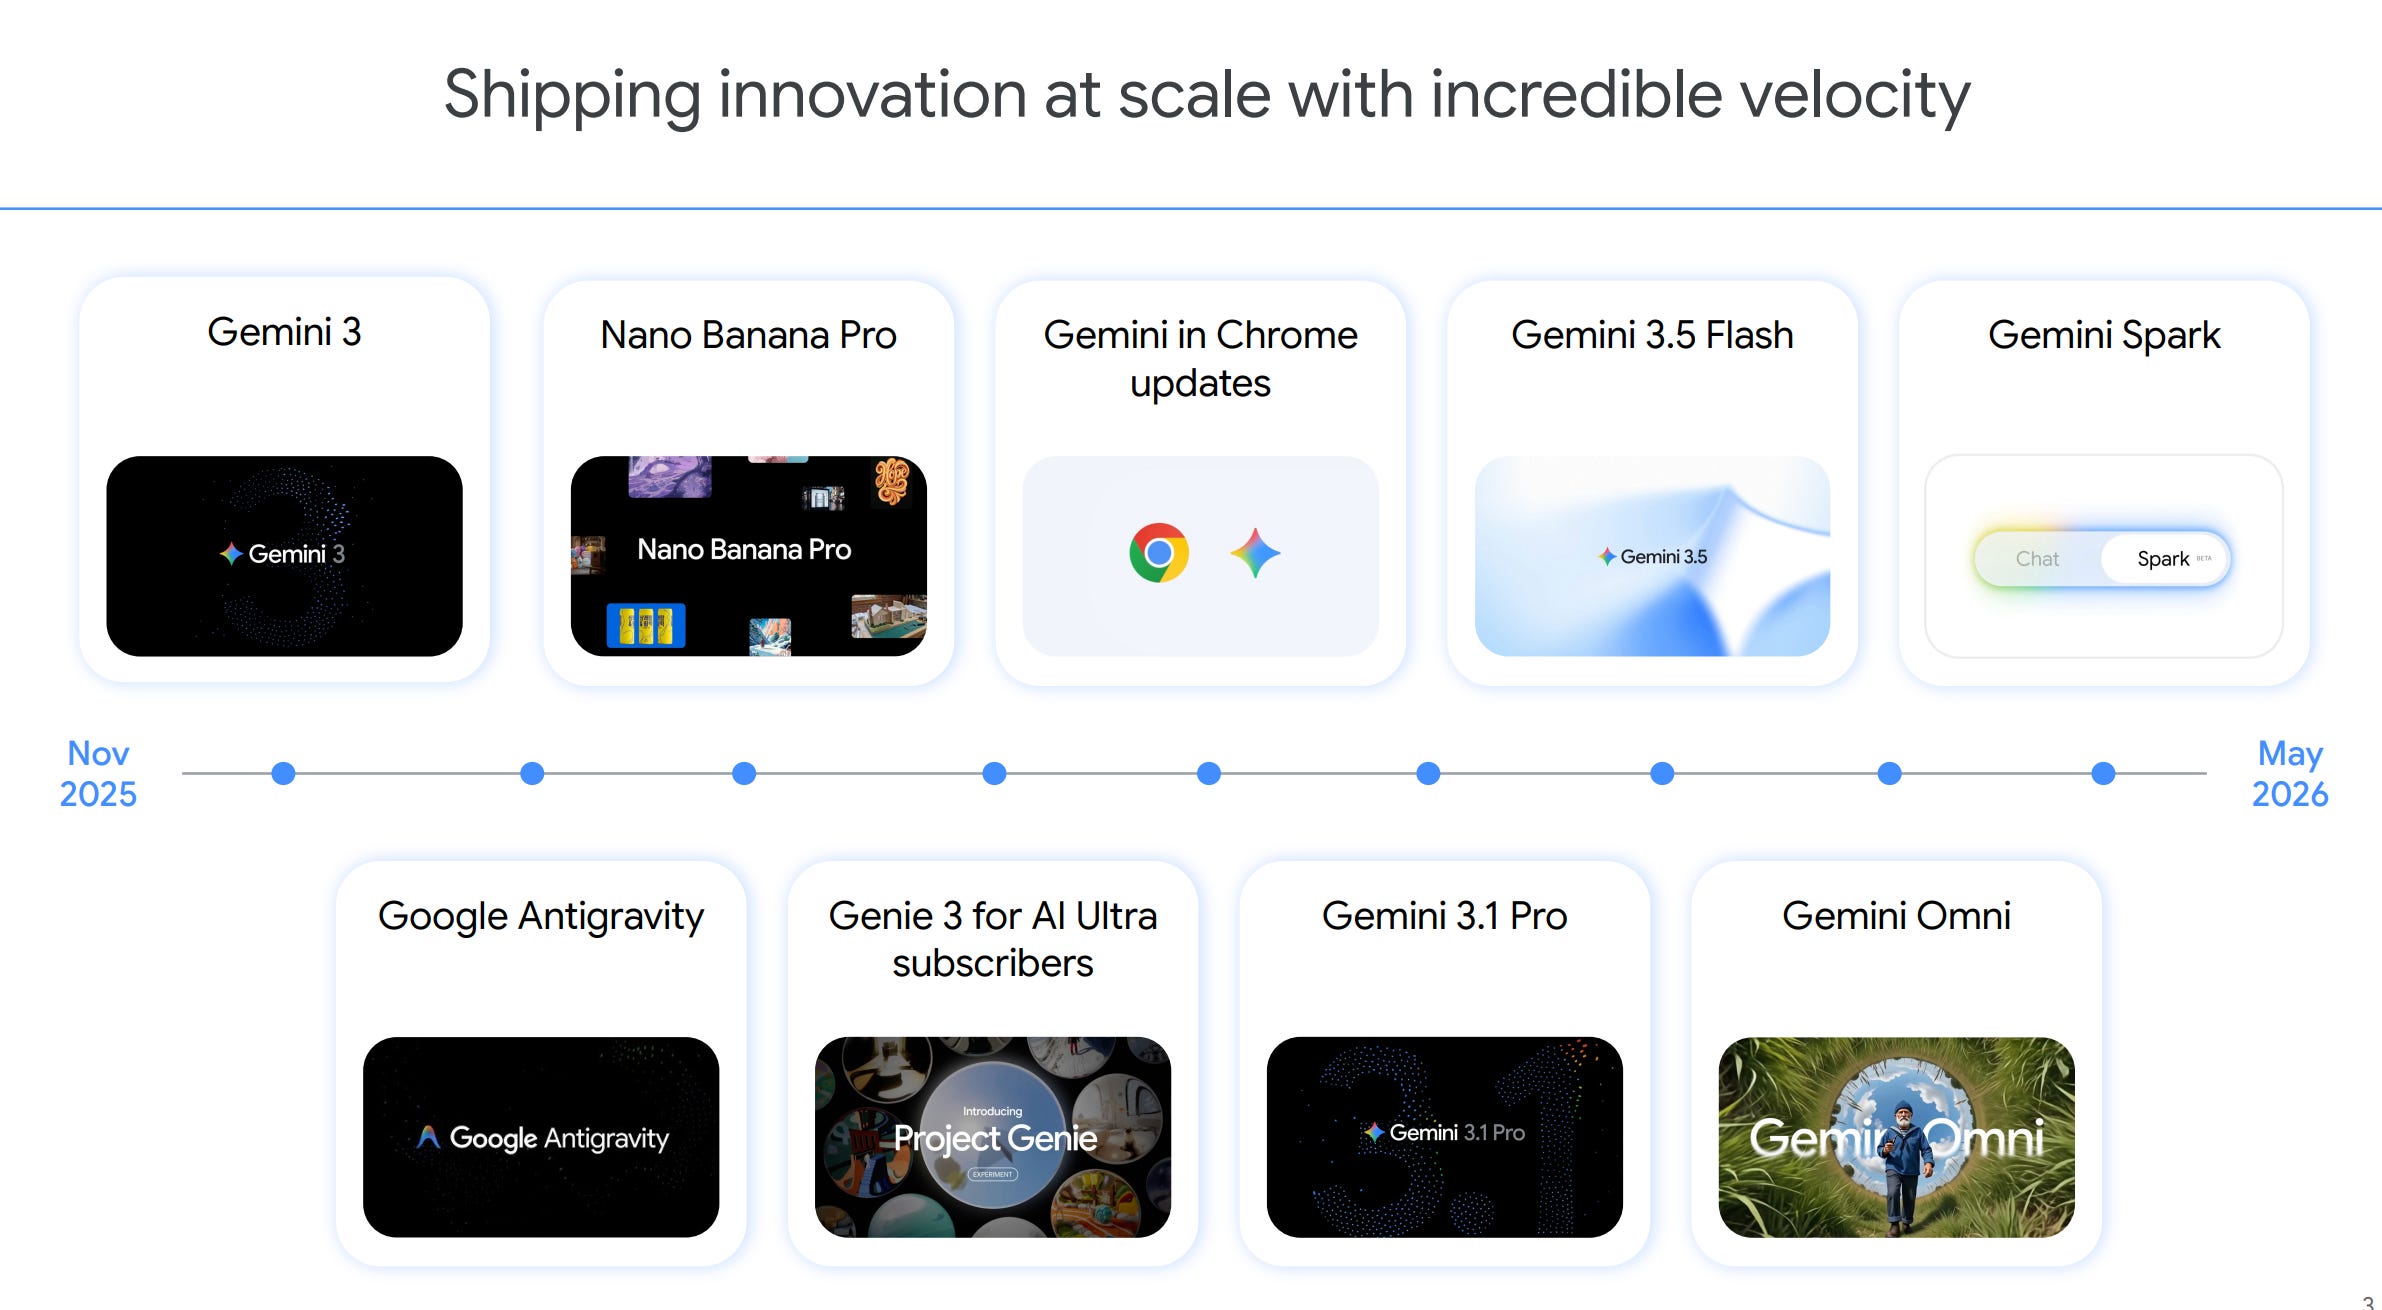
GOOG 0.00%↑ has been shipping their AI products with accelerated speed taking control of the narrative over their search disruption and turning it on it’s head. You can see the level of their innovation with the timeline from Nov 2025 to May 2026 updating several models and products within that time frame.
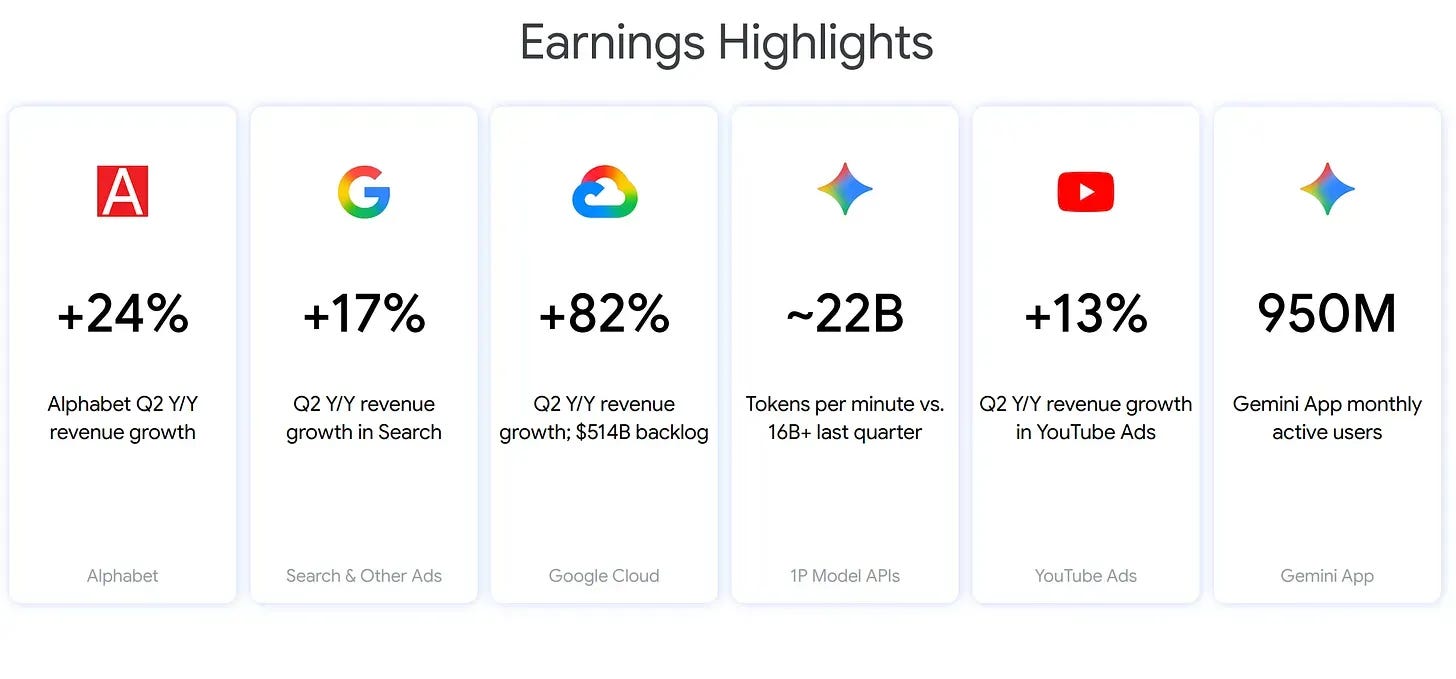
Also let’s look at their amazing earnings highlights. Most notably from the graphic below is that Google Cloud rose 82% Y/Y with a backlog of $514 B. This is phenomenal growth from this division and the other results were also great.
But why did the stock go down initially after the earnings?
The reason is AI capex. This narrative has clouded the hyperscalers to no end recently and it’s clear why. A lot of these companies are getting to a point of negative free cash flow and debt to pay for their AI capex obligations. This directly affects the value of shareholders and they don’t seem to like it.
Let’s take another look at their valuation after this earnings report. I calculated an intrinsic value of $362.27 per share last time around the Q1 ‘26 earnings using my google sheet template.
However, I have started using a more comprehensive look at valuation using Stock Analysis going forward.
A sidebar here: if you are a serious investor or thinking about becoming a serious investor, use Stock Analysis to analyze stocks. It’s much easier than writing your own DCF tables and performing a cash flow analysis. You can get a discount using code ‘BEARD’ at this link: https://stockanalysis.com/pro/?ref=beardedinvestor.
So using Stock Analysis, I pulled up the forecast and valuation of GOOG 0.00%↑ based on the number of analysts covering the stock. Check it out here, but let’s go through the data.
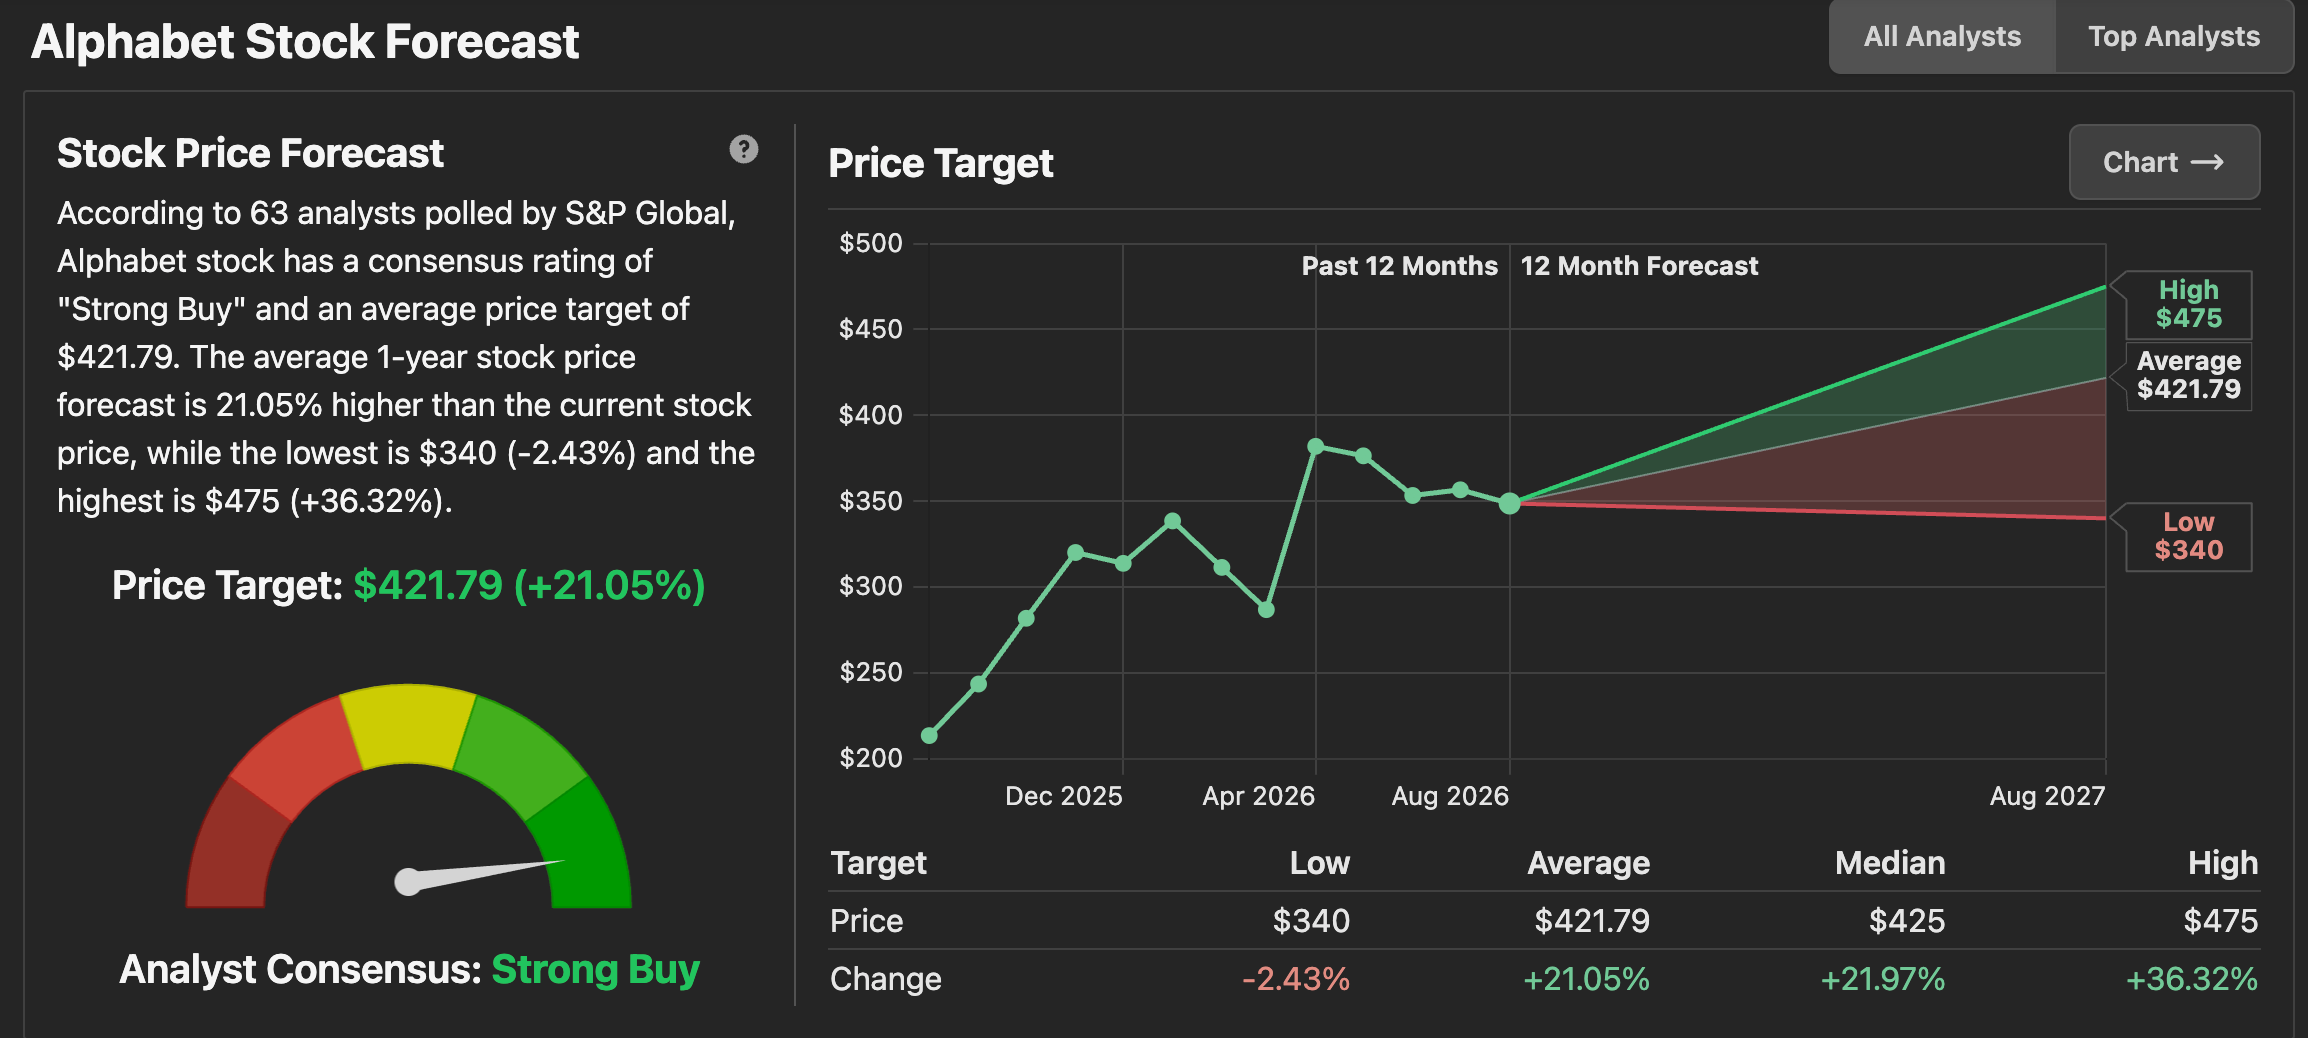
Stock Analysis first gives you a clear indication whether the stock is a buy or not with a price target and an analyst consensus buy rating. Here we can see that GOOG 0.00%↑ is considered a Strong Buy.
In addition, there is a 12 month forecast that is more useful than a 10 year projection for all practical matters. If the 12 month projection does not look good AND the fundamentals are weak or non-existent, I wouldn’t buy and hold the company for 10+ years anyways.
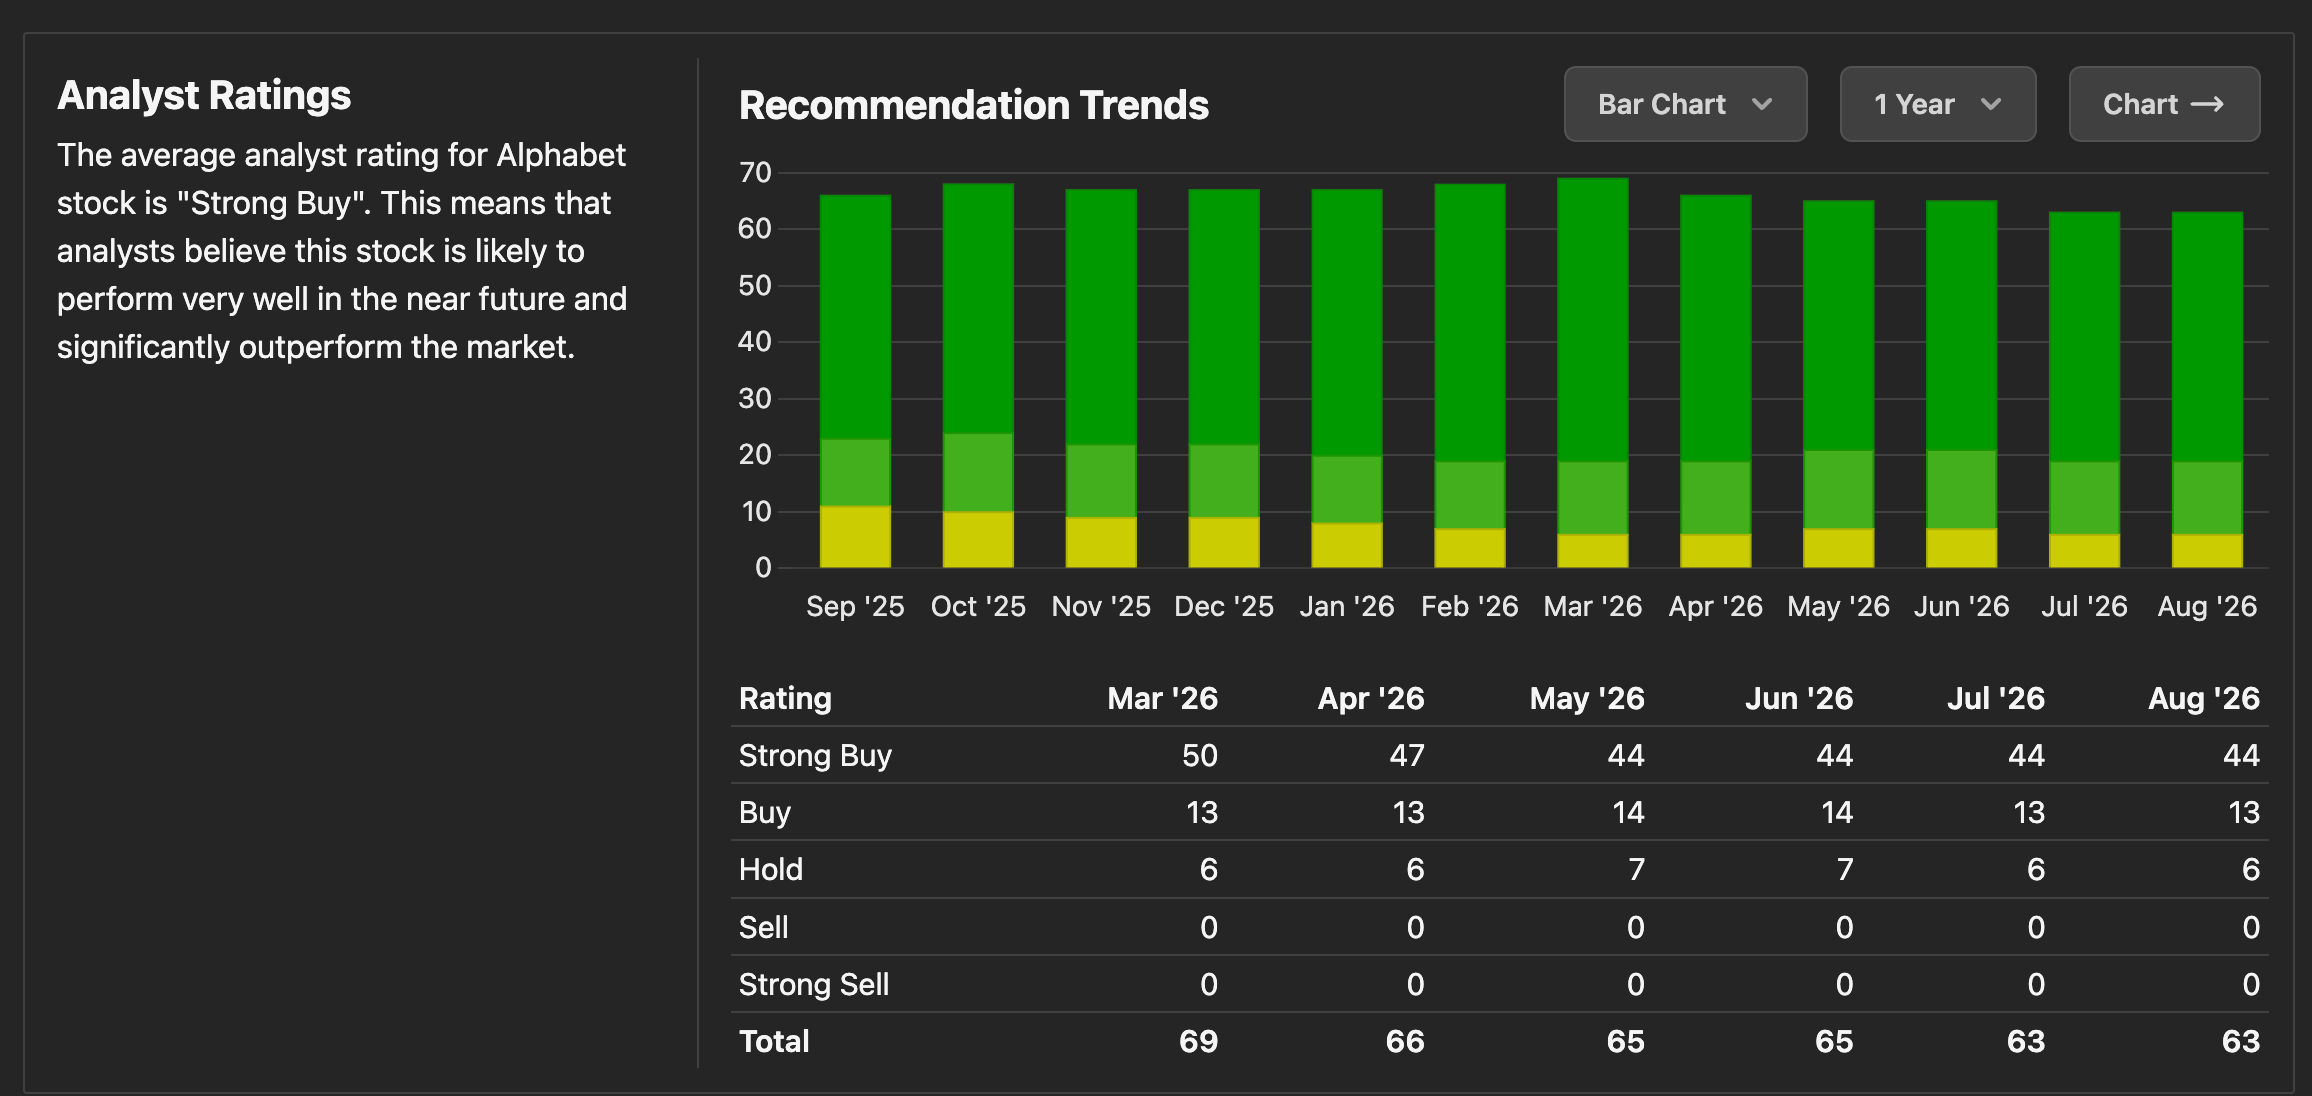
Another highly useful feature on Stock Analysis is the recommendation trends to see where analysts fall on the spectrum of Strong Buy all the way to Strong Sell ratings. This gives weight to the analyst ratings. You can then see which rating the majority of analysts (who have the means and research data to run these advanced DCF models) are leaning towards.
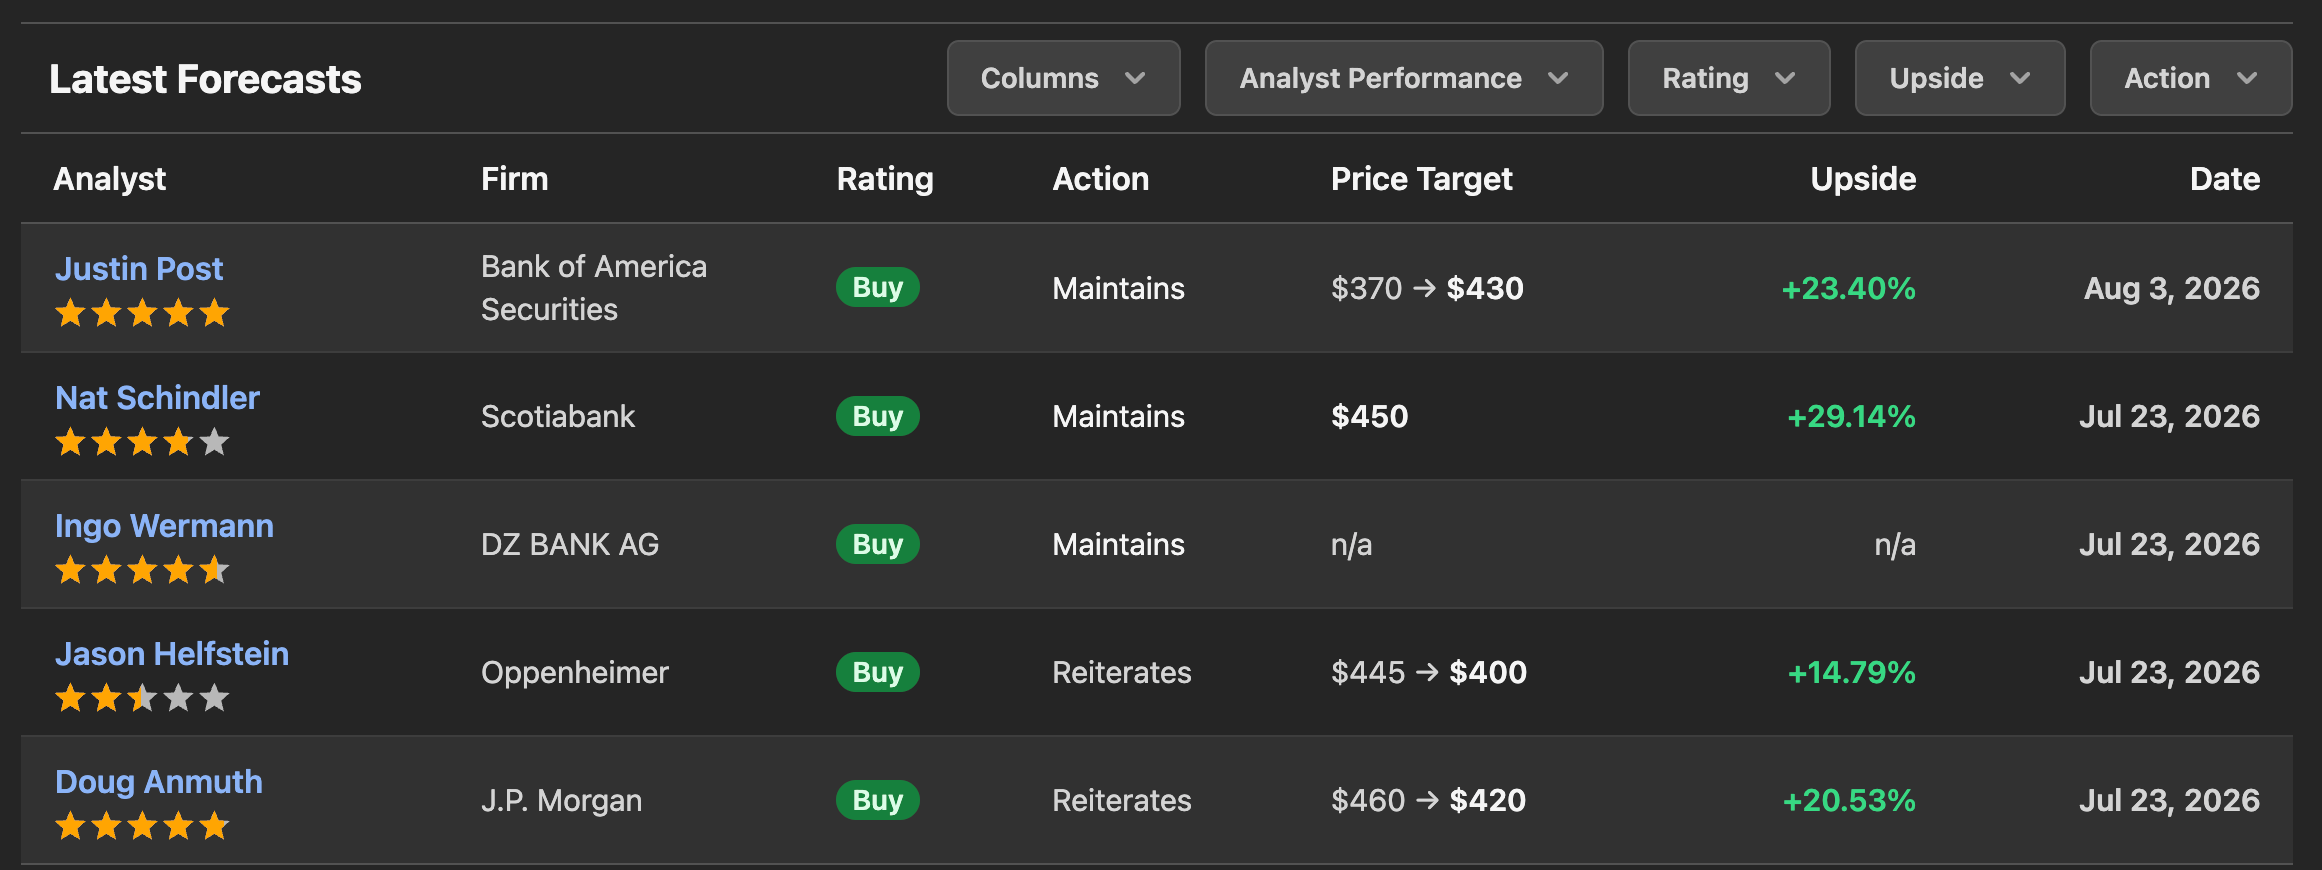
Analyst rating upgrades and downgrades are also super important to see the latest information and news about a particular stock. GOOG 0.00%↑ seem to be having upward revisions after their earnings report.

The financial forecast is also super important as it can tell you whether a business is going to experience a slowdown that we as retail investors may not be able to see or forecast. GOOG 0.00%↑ seems to be indicating an EPS decrease next year possibly due to the high capex they are projecting. Even so, their other metrics like revenue look like they are trending up.
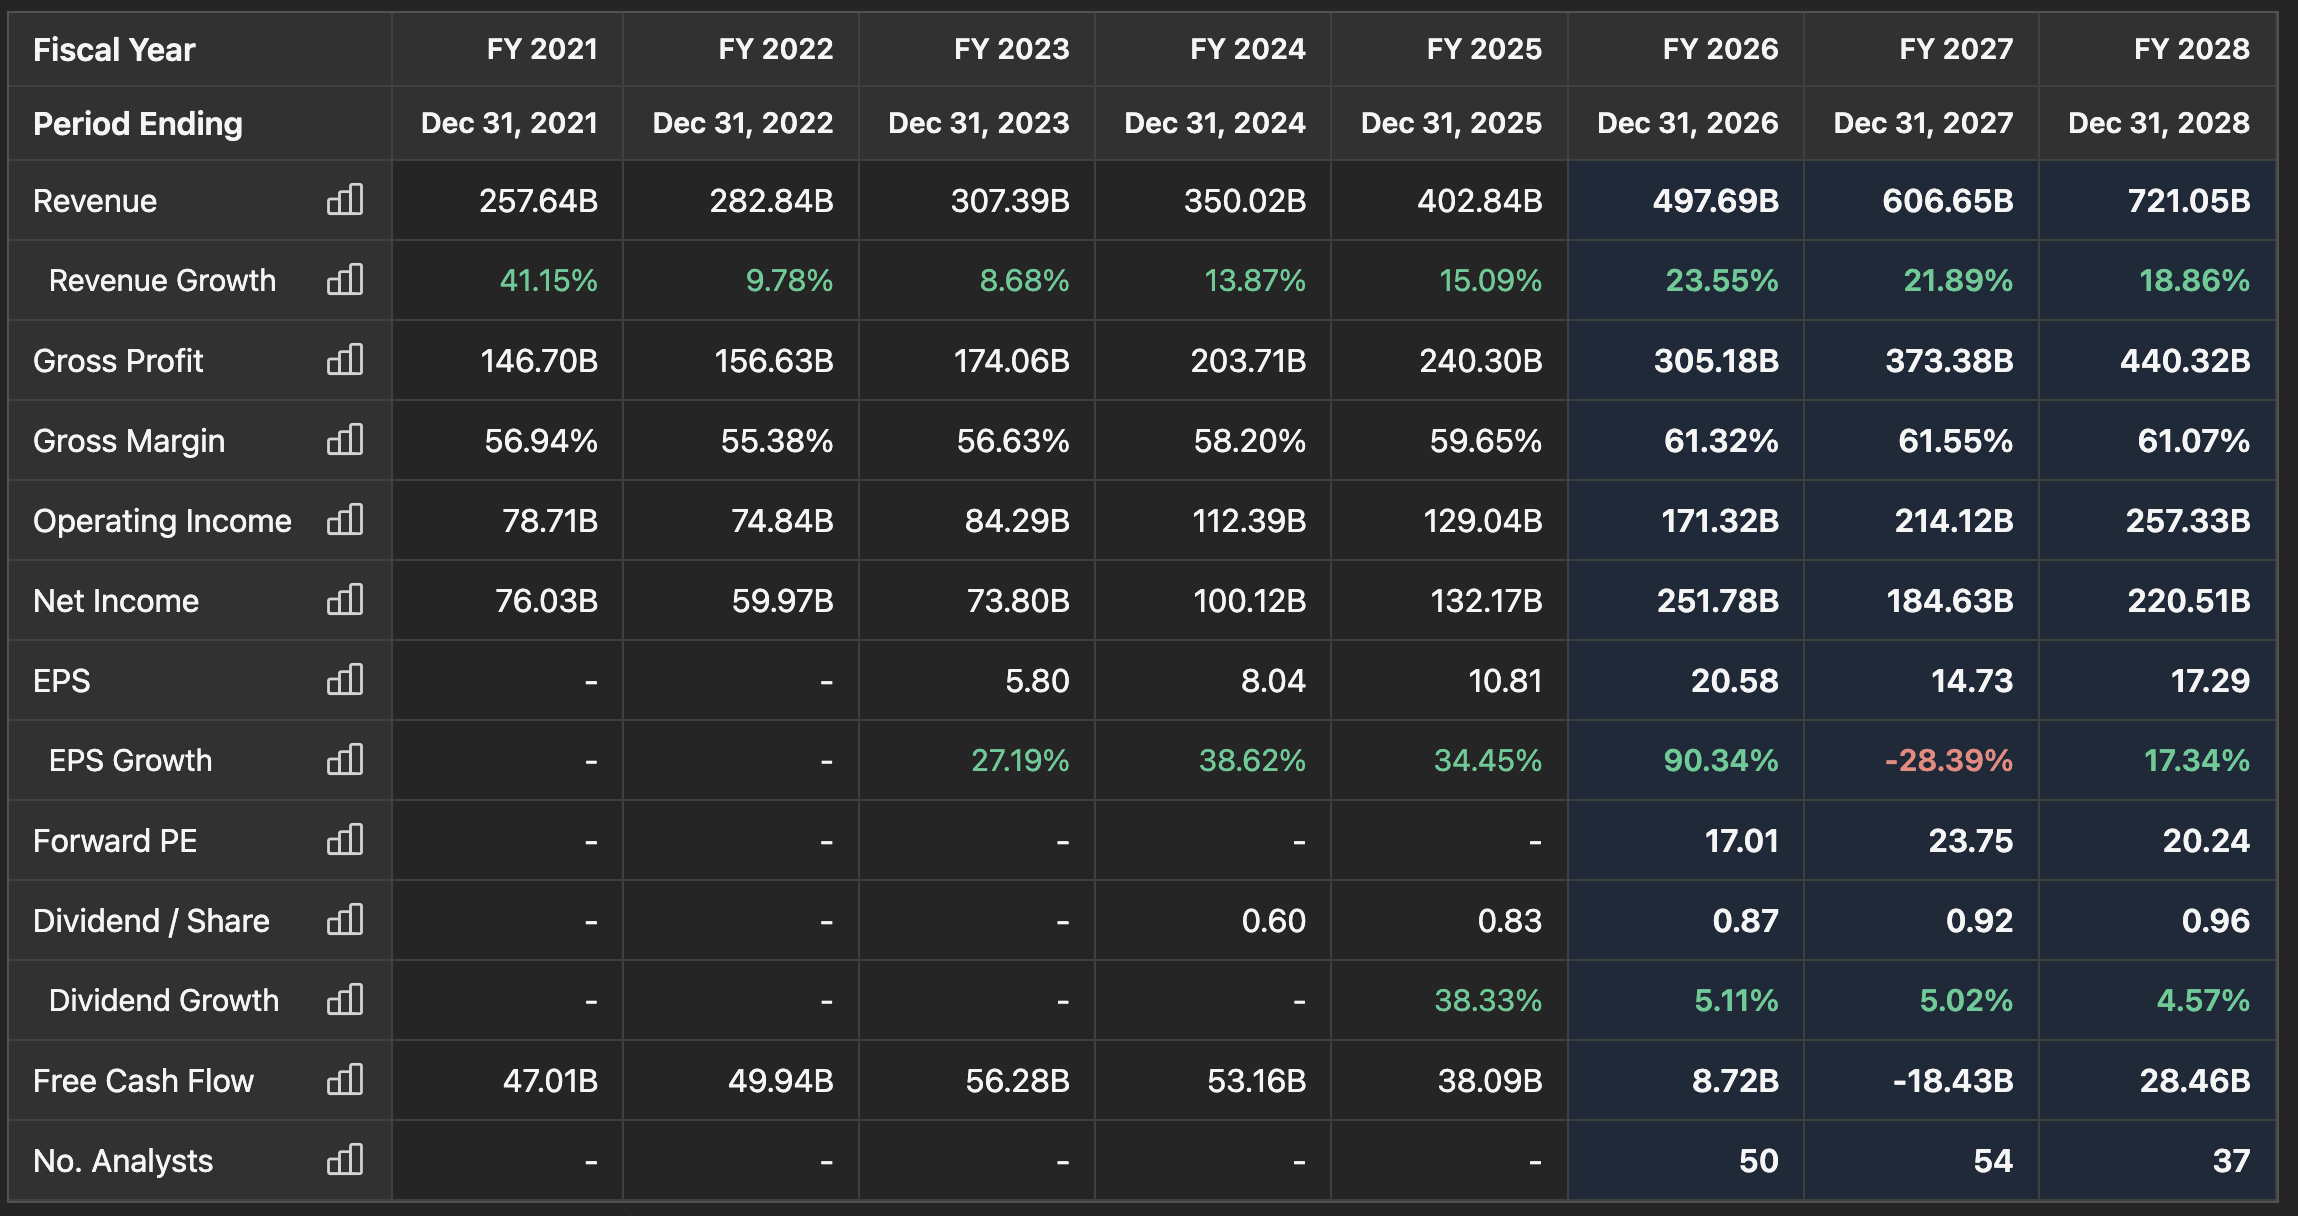
The most important table that I look at this forecast table. It shows the projected numbers for future years. GOOG 0.00%↑ is showing good revenue growth numbers, maintaining gross margin, but will have an issue with their EPS growth rates in 2027. Free cash flow looks bad in 2027 as well with a recovery in 2028. This can be useful to determine when a great investment can be bought at a good price.
Not financial advice. Please do your own due diligence when investing your own money.